Voice application dashboard
The Dashboard is the first page of every voice application. It shows what is waiting on someone right now, then sums up the calls in a period, so you can start the day there.
- The Voice IntELIEgence app in your top bar.
- This permission: Voice · Dashboard - View.
- A voice application with at least one conversation. Every figure below the top strip covers the period you pick, never all time.
If Voice IntELIEgence isn't in your top bar, your role can't view it or your plan doesn't include it. Ask a workspace administrator, or see Permissions and module visibility.
Steps
Open the Dashboard
Open the application from Voice Applications; it opens on Dashboard. From anywhere else in the application, select Dashboard at the top of its menu.
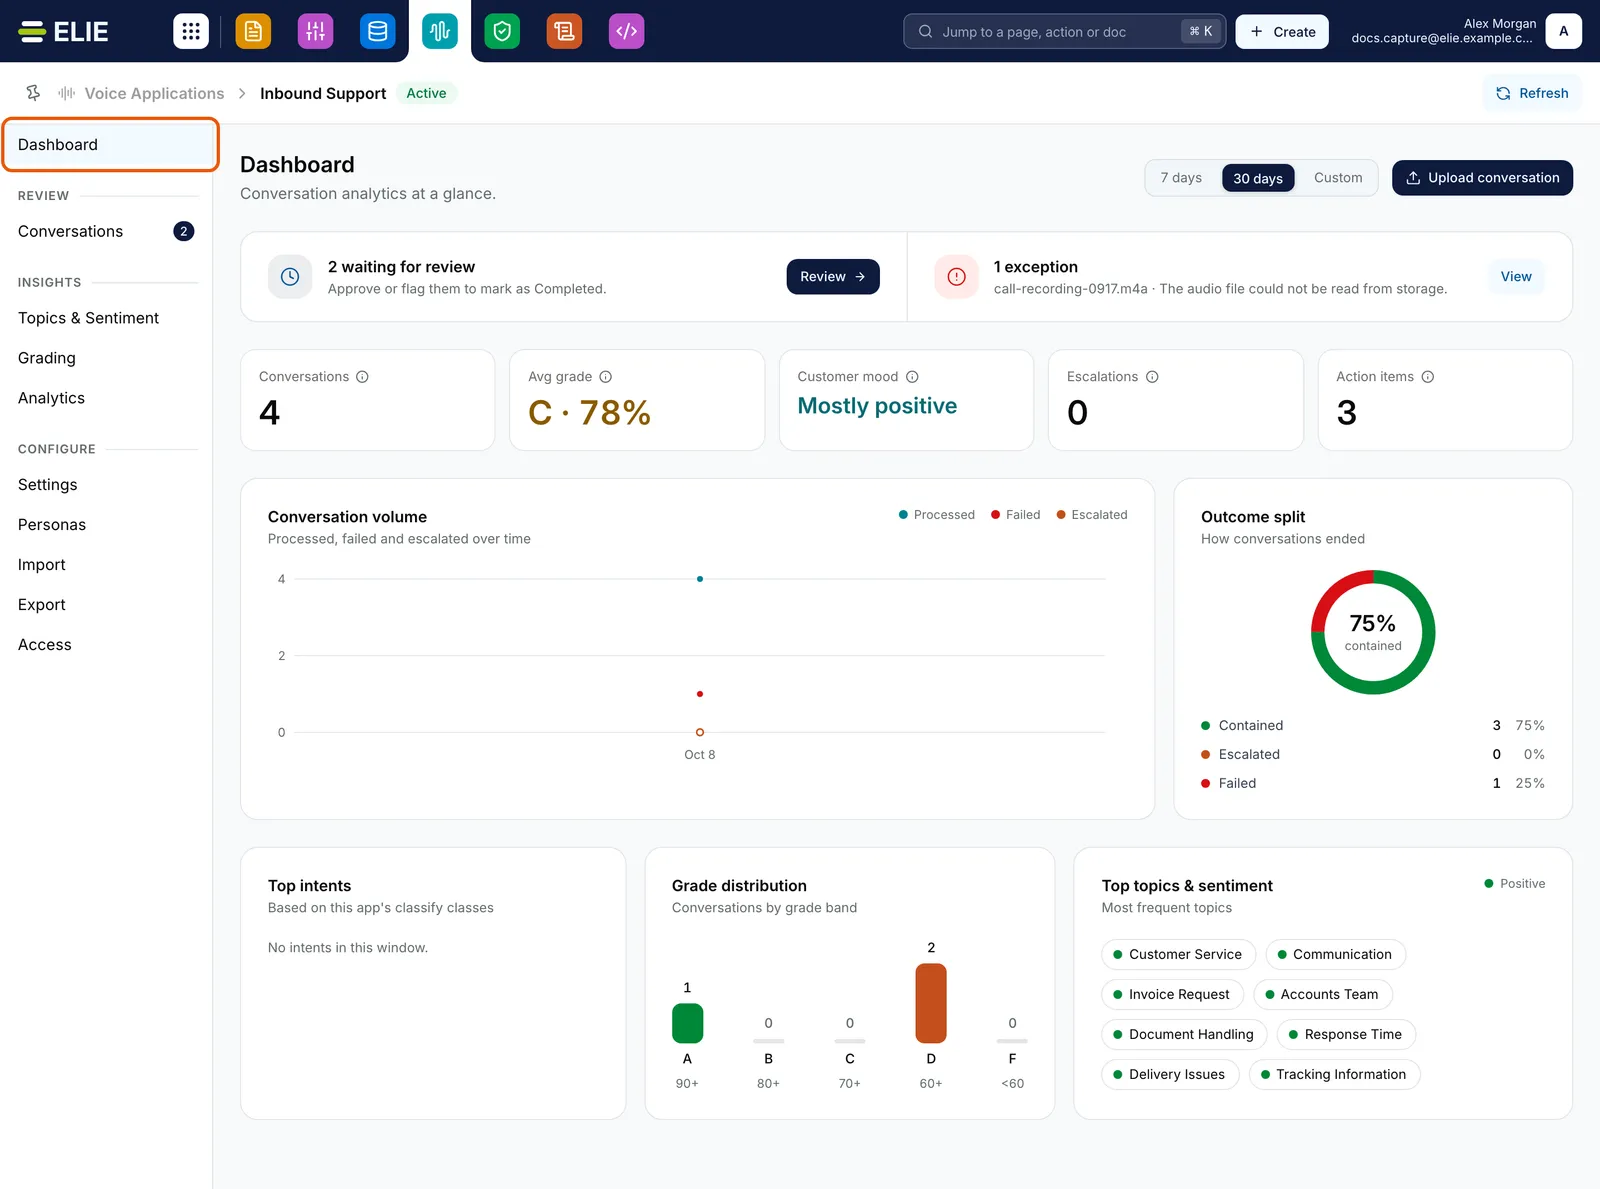
Inbound Support's Dashboard set to 30 days with Dashboard ringed in the menu: the strip with 2 waiting for review and 1 exception, then 4 conversations, average grade C 78%, Mostly positive, 0 escalations and 3 action items, above Conversation volume, Outcome split, Top intents, Grade distribution and Top topics & sentiment. EnlargeClear what needs attention
The strip at the top counts the calls waiting for review and the calls that ended at Exception, naming the latest failure. Review and View open Conversations showing just those calls. The strip is absent when nothing is waiting.

The needs-attention strip: 2 waiting for review with a Review button, and 1 exception naming call-recording-0917.m4a and why it failed, with a View button. EnlargePick the period
Choose 7 days, 30 days or Custom at the top right. It starts at 30 days. Custom opens a calendar with presets; pick a start and end, then select Apply.
Read the headline figures
The row of tiles shows Conversations, Avg grade, Customer mood, Escalations and Action items, each with its change on the previous period of the same length. Select the information icon on a tile to see exactly what it counts.
Read the charts
Conversation volume plots processed, failed and escalated calls per day, and Outcome split shows how they ended. Top intents appears when the application classifies calls, Grade distribution when it grades them, and Top topics & sentiment when it finds topics.


What success looks like
- The tiles and charts change when you change the period; the strip at the top does not.
- Review opens Conversations filtered to Waiting for review.
What the figures count
Conversations counts every call added in the period, whatever state it is in. Avg grade averages graded calls only; an ungraded call is left out rather than counted as zero. Customer mood is the share of analysed calls that came out positive, and appears only while the Topics & sentiment output is on. Escalations counts calls the analysis flagged as an escalation; calls that failed to process are not escalations, and show in the strip as exceptions instead.
If something goes wrong
| Symptom | Likely cause | What to do |
|---|---|---|
| The page reads No data yet, with no period switch. | Nothing has been processed in the last 30 days, or nothing has been uploaded at all. | Select Upload conversation or Connect import source on the card. |
| No data in this period. | Nothing was processed in the period you picked. | Choose a wider period. |
| Failed to load analytics. | A temporary problem reaching the service. | Select Retry. |
| Avg grade shows a dash. | Grade was off for the calls in the period. | Turn it on. It applies to new calls only. See Grading conversations. |
| Dashboard is missing from the menu. | Your role cannot view this application's dashboard. | Ask the owner or an administrator. See Access. |

Next
- Voice analytics - per-agent figures and channels.
- The Voice IntELIEgence overview - the same backlog across every application.
- Reviewing a conversation - acting on a call that needs attention.